
Wild Jihadis--A Statistical Analysis
Graphs--How a Good Visual Makes a Complex Concept Understandable
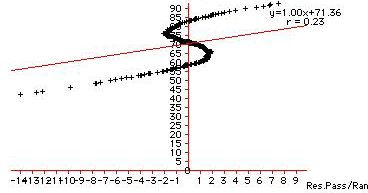
Figure 1.
Fig. 1 is a graphic display of the relations between the residuals of the percent feral jihadi/US interest in it's own vital national interests across rank. While it stands as an odd set of things to compare statistically, I did it to improve visualization of the behavior of the very top and very bottom of most jihadi groups as it relates to US foreign policy. No correlation (r = 0.0) is what we might expect with this particular analysis. However, the regression was run to better view the curving at the ends of the percent of western interventions. . . something it clearly shows. Note that the behavior of those jihadi packs ranking lowest (upper left-hand area) and those jihadi packs ranked highest (lower, right-hand area) show very definite skewing in the extent to which they over/under performed in terms of direct correlation to U.S. military retaliations where vital national interests are concerned.
Simply interpreted, the data show the jihadis with the very highest and very lowest rates of success as having exaggerated tendency in the direction of their overall performance. I am not certain if there is a statistical significance in this. I am currently attempting to get expert advice on whether there are enough cases in the very highest and lowest groups to merit further analysis (logistical). Stay tuned. . .
posted by Pile On® @ 11:11 AM
|
![]()
![]()

<< Home